
Building an Excel add-in for HBase MapReduce
Summary
This latest project from JNBridge Labs investigates building an Excel add-in for Hadoop HBase. As a Java framework, HBase applications must use Java APIs, resulting in single-platform solutions. A cross-platform HBase integrated solution, particularly one that provides business intelligence on the desktop, like Microsoft Excel, is unable to leverage the HBase remote client API. This means using a lower level interoperability mechanism, like implementing a .NET Thrift client. The current project uses JNBridgePro for .NET-to-Java interoperability. It also leverages concepts and code from the previous lab, Building a LINQ provider for HBase MapReduce, which investigated a LINQ extension for HBase.
Introduction
Hadoop allows businesses to quickly analyze very large data sets. Hadoop can reduce ludicrous amounts of data to a meaningful answer in a short amount of time, however, without understanding the shape of your data, you run the risk of garbage in, garbage out. Analysis itself is an iterative process relying on investigation. Tools that aid data investigation provide a means to quickly view, sort, filter/reduce and represent data, making it possible to quickly find and understand patterns, trends and relationships.
Microsoft Excel has always been the ubiquitous off-the-shelf tool for data analysis and it makes a ready-to-go front end for Hadoop. Excel can be extended using add-ins developed in Visual Studio using VSTO, Visual Studio Tools for Office. This lab will explore a simple Excel front-end to HBase MapReduce. The front-end will allow a user to view HBase tables and execute MapReduce jobs. The goal is to make the add-in generic with respect to the column definitions and data in a HBase table.
Getting Started
The components required for this lab are identical to those required in the previous lab, Building a LINQ provider for HBase MapReduce. Here’s a quick list of the components.
- Apache Hadoop Stack (see the previous lab’s Getting Started section for more information)
- Visual Studio 2012
- Eclipse
- JNBridgePro 7.0
- Office Developer Tools for Visual Studio 2012 (this includes VSTO).
- Microsoft Office 2010
Calling Java from .NET: Creating proxies using JNBridgePro
Since the Excel add-in is written in C#/.NET and needs to call several Java class APIs, the first step is to use the JNBridgePro plug-in for Visual Studio to create an assembly of proxies that represent the Java API. When a proxy of a Java class is instantiated in .NET, the real Java object is instantiated in the Java Virtual Machine. The JNBridgePro run-time manages communications, i.e. invoking methods, and syncing garbage collection between the .NET CLR and the JVM.
For this development step, as well as during run-time, a bunch of Hadoop, HBase and ZooKeeper JAR files must be available on the Windows machine. These can be scraped from a machine running the Hadoop stack (look in /usr/lib/hadoop/lib, /usr/lib/hbase/lib, etc.)
This is a screen shot of the Edit Class Path dialog for the JNBridgePro Visual Studio plug-in.
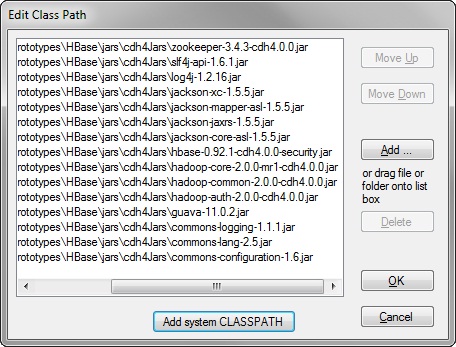
These are the JAR files required to create the .NET proxies. During run-time, three additional JAR files must be included in the JVM’s class path when initiating the bridge between the JVM and the CLR: avro-1.5.4.jar, commons-httpclient-3.1.jar and slf4j-nop-1.6.1.jar (the last JAR file inhibits logging by Hadoop and HBase).
Below, is a screen shot of the JNBridgePro proxy tool in Visual Studio. The left hand pane shows all the namespaces found in the JAR files shown in the above dialog. The required namespaces are org.apache.hadoop.hbase.client and org.apache.hadoop.hbase.filter. In addition, individual classes like org.apache.hadoop.hbase.HBaseConfiguration are required (see the link at the end of this blog to download the source).
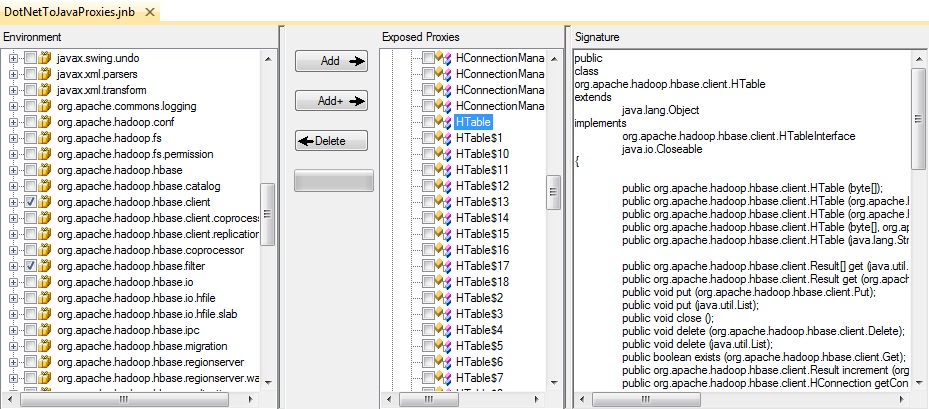
By clicking on the Add+ button, the chosen classes, as well as every dependent class, will be found and displayed in the center pane. The right-hand pane displays the public members and methods of the Java HTable class. The last step is to build the proxy assembly, DotNetToJavaProxies.dll.
Creating and populating an HBase Table
It would be nice to have an HBase table loaded with data and provide an opportunity to test calling various HBase Java APIs from .NET. The simple data will consist of an IP address, like “88.240.129.183″ and the requested web page, for example “/zebra.html”. This lab will use the same table, access_logs, created for the previous lab, Building a LINQ provider for HBase MapReduce. Please see the previous lab’s section, Creating and populating an HBase Table, for the code used to build this table.
Building an Excel add-in
The Excel add-in will consist of a single control pane. As the user interacts with the pane, underlying code accesses the Excel data model consisting of workbooks, worksheets and charts. Here’s what the completed add-in looks like.
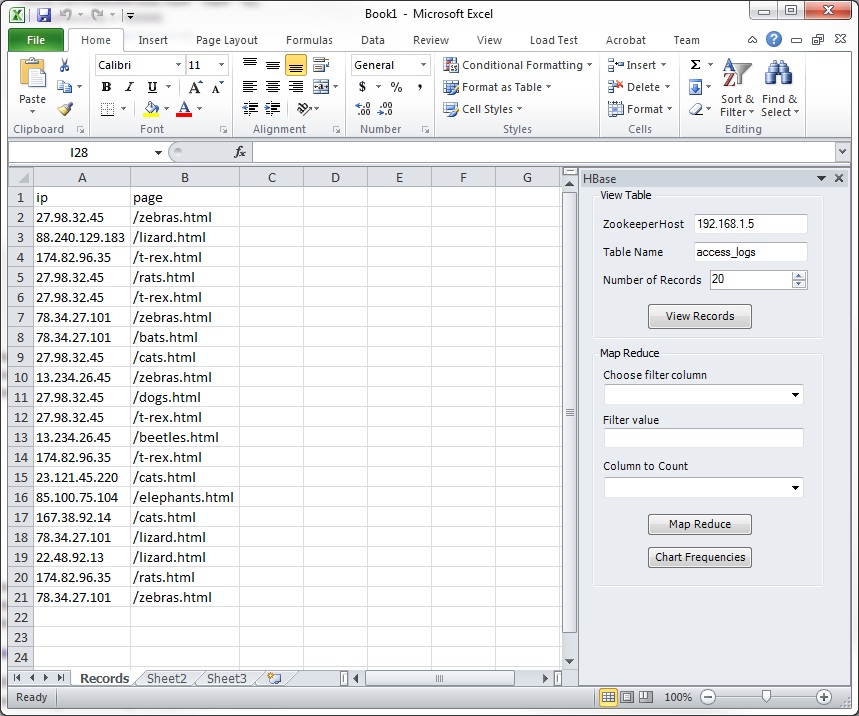
The class HBasePane is a .NET User Control. It consists of two groups, View Table and Map Reduce. The above screen shot shows the user controls labeled Zookeeper Host, Table Name and Number of Records, which all have user entered values. By clicking on the button, View Records, the user has loaded in 20 rows from the HBase table, access_logs.
Here’s the handler code for the button click event.
        private void viewTableButtonClick(object sender, EventArgs e)
        {
            Excel.Worksheet activeWorksheet
                 = ((Excel.Worksheet)Globals.ExcelHBaseAddIn.Application.ActiveSheet);
            activeWorksheet.Name = "Records";
            Excel.Range navigator = activeWorksheet.get_Range("A1");
            int numRows = Decimal.ToInt32(this.numberOfRecords.Value);
            // most of the work done here
            this.columns = ViewHBaseTable.populateWorkSheet(navigator
                , this.hostName.Text
                , this.tableName.Text
                , numRows);
            // autofit the range
            int numCols = this.columns.Count<string>();
            Excel.Range c1 = activeWorksheet.Cells[1, 1];
            Excel.Range c2 = activeWorksheet.Cells[numRows, numCols];
            this.cols = activeWorksheet.get_Range(c1, c2);
            this.cols.EntireColumn.AutoFit();
            // populate the user controls with the column names
            this.filterComboBox.Items.AddRange(this.columns);
            this.frequencyComboBox.Items.AddRange(this.columns);
        }
All the work is done in the method, ViewHBaseTable.populateWorkSheet(). The user controls are hostName, tableName and numberOfRecords. The hostName control contains the address of the machine that’s running Zookeeper, which is responsible for managing connections from the HBase client API. Below is code from populateWorkSheet(). Notice that the HBase table column family and cell names are obtained using the methods getFamily() and getQualifier() along with the cell values. The method returns an array of strings that represents the column and cell names in the table. These are used to populate the combo box controls filterComboBox and frequencyComboBox in the group Map Reduce.
            Configuration hbaseConfig = HBaseConfiguration.create();
            hbaseConfig.set("hbase.zookeeper.quorum", hostName);
            try
            {
                HTable tbl = new HTable(hbaseConfig, tableName);
                Scan scan = new Scan();
                ResultScanner scanner = tbl.getScanner(scan);
                Result r;
                while (((r = scanner.next()) != null) && ndx++ < numRecords)
                {
                    List aList = r.list();
                    ListIterator li = aList.listIterator();
                    while (li.hasNext())
                    {
                        kv = (KeyValue)li.next();
                        familyName = Bytes.toString(kv.getFamily());
                        cellName = Bytes.toString(kv.getQualifier());
                        value = Bytes.toString(kv.getValue());
                        // make a unique list of all the column names
                        if (!names.Contains(familyName + ":" + cellName))
                        {
                            names.Add(familyName + ":" + cellName);
                        }
                        // add headers
                        if (currentRow == 2)
                        {
                            currentCell = navigator.Cells[1, currentColumn];
                            currentCell.Value2 = cellName;
                        }
                        currentCell = navigator.Cells[currentRow, currentColumn++];
                        currentCell.Value2 = value;
                    }
                    currentRow++;
                    currentColumn = 1;
                }
                scanner.close();
                tbl.close();
            }
            catch (Exception ex)
            {
                throw ex;
            }
            return names.ToArray<string>();
        }
Generic filtering and frequency user interface
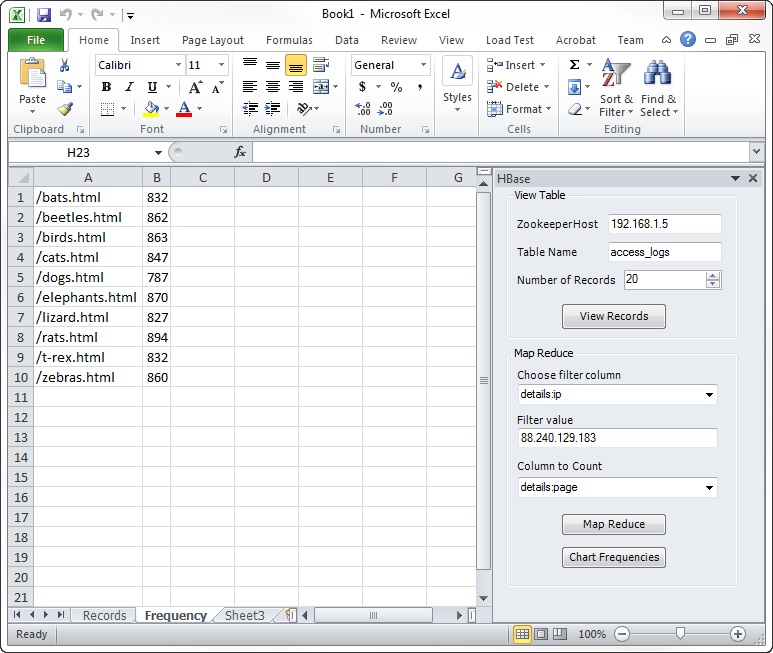
Below is a close-up screenshot of the HBase pane. The interface in the View Table group allows the user to point to a Hadoop implementation, choose a table and the number of records to load into the active worksheet. Once that is done, the user can then define a MapReduce job using the controls in the Map Reduce group.
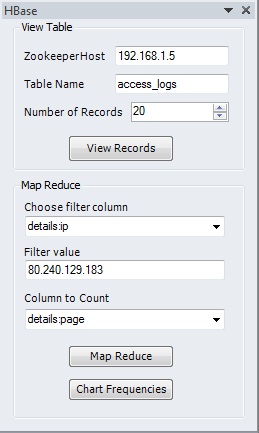
The user interface allows filtering on any one column. The combo box control labeled Choose filter column contains all the column names in the form family:cell. The text box labeled FilterValue is the filter which elides all rows where the chosen column doesn’t match the filter value. The combo box labeled Column to Count is used to choose the column whose values will be grouped and counted. The above values ask the question: “What are the pages—specifically the frequencies of the pages— visited by the IP address 80.240.129.183“.
When the button, Map Reduce, is clicked, this handler is invoked:
        private void onMapRedButtonClick(object sender, EventArgs e)
        {
            this.filterColumn = this.filterComboBox.Text;
            this.filterValue = this.filterValueTextBox.Text;
            this.frequencyColumn = this.frequencyComboBox.Text;
            Excel.Worksheet activeWorksheet
                = ((Excel.Worksheet)Globals.ExcelHBaseAddIn.Application.Worksheets[2]);
            activeWorksheet.Name = "Frequency";
            Excel.Range navigator = activeWorksheet.get_Range("A1");
            // most of the fun stuff happens here
            int numRows = MapReduce.executeMapReduce(navigator
                , this.filterColumn
                , this.filterValue
                , this.frequencyColumn
                , this.hostName.Text
                , this.tableName.Text);
            // autofit the range
            Excel.Range c1 = activeWorksheet.Cells[1, 1];
            Excel.Range c2 = activeWorksheet.Cells[numRows, 2];
            this.cols = activeWorksheet.get_Range(c1, c2);
            this.cols.EntireColumn.AutoFit();
            // bring the worksheet to the top
            activeWorksheet.Activate();
        }
All the work is done by the method MapReduce.executeMapReduce(), partially shown below. The .NET-to-Java method call, HBaseToLinq.FrequencyMapRed.executeMapRed(), is almost the same Java code used in the previous lab, Building a LINQ provider for HBase MapReduce. The only modifications have been to remove hard-coded column names, instead using the programmatic column names for filtering and frequency counts chosen by the user. The method then scans the results of the MapReduce job stored in the table, summary_user, and loads them into a worksheet, returning the number of records in the results table.
            try
            {
                HBaseToLinq.FrequencyMapRed.executeMapRed(hostName
                    , tableName
                    , frequencyColumn
                    , columnToFilter
                    , filterValue);
            }
            catch(Exception ex)
            {
                throw ex;
            }
            Configuration hbaseConfig = HBaseConfiguration.create();
            hbaseConfig.set("hbase.zookeeper.quorum", hostName);
            try
            {
                string cellName =
                     frequencyColumn.Substring(frequencyColumn.IndexOf(":") +1);
                string familyName =
                     frequencyColumn.Substring(0, frequencyColumn.IndexOf(":"));
                HTable tbl = new HTable(hbaseConfig, "summary_user");
                Scan scan = new Scan();
                ResultScanner scanner = tbl.getScanner(scan);
                Result r;
                while ((r = scanner.next()) != null)
                {
                    rowKey = Bytes.toString(r.getRow());
                    count = Bytes.toInt(r.getValue(Bytes.toBytes(familyName)
                         , Bytes.toBytes("total")));
                    currentCell = navigator.Cells[currentRow, currentColumn++];
                    currentCell.Value2 = rowKey;
                    currentCell = navigator.Cells[currentRow++, currentColumn];
                    currentCell.Value2 = count;
                    currentColumn = 1;
                }
                scanner.close();
                tbl.close();
            }
            catch (Exception ex)
            {
                throw ex;
            }
            return currentRow - 1;
Here’s a screen shot of the Excel add-in after performing the MapReduce.
Visualizing data
Data visualization through graphs and charts is an important final step when investigating and analyzing data. Clicking on the button Chart Frequencies causes the add-in to create a stacked column chart of the Frequency worksheet. Here’s the code for the handler, onChartFrequenciesClick().
        private void onChartFrequenciesClick(object sender, EventArgs e)
        {
            Excel.Workbook wb = Globals.ExcelHBaseAddIn.Application.ActiveWorkbook;
            Excel.Chart chart = (Excel.Chart)wb.Charts.Add();
            chart.ChartType = Excel.XlChartType.xlColumnStacked;
            chart.SetSourceData(this.cols, Excel.XlRowCol.xlColumns);
            chart.HasTitle = true;
            string filterName = this.filterColumn.Substring(this.filterColumn.IndexOf(":") + 1);
            string frequencyName
                 = this.frequencyColumn.Substring(this.frequencyColumn.IndexOf(":") + 1);
            chart.ChartTitle.Text = "Frequency of "
                  + frequencyName
                  + " when " + filterName
                  + " = " + this.filterValue;
        }
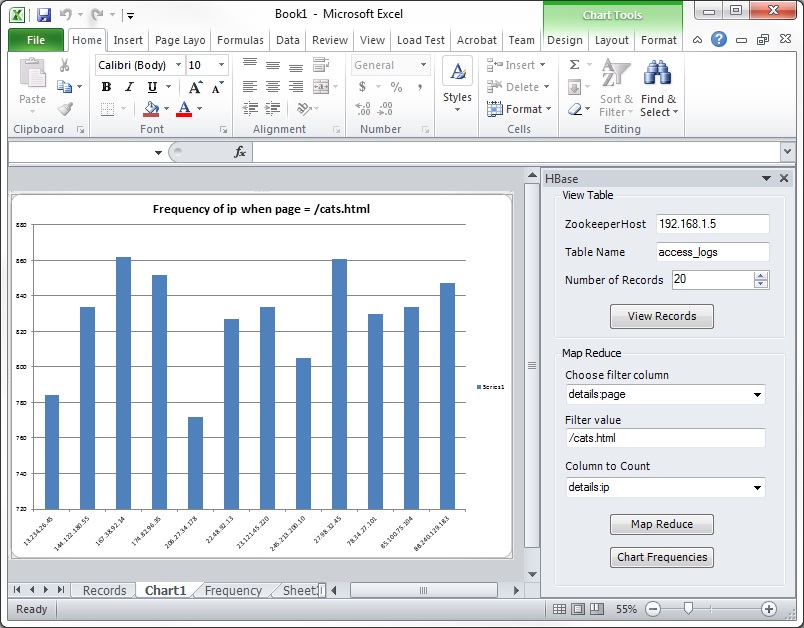
This screen shot of the add-in shows the resulting chart. Notice that the MapReduce columns for filtering and frequency are different than the previous example. Here, the question being asked is “What is the frequency of visiting IP addresses for the page, /cats.html”.
Conclusion
Building an Excel add-in that supports viewing any HBase table of column families and provides filtering and Map Reduce frequency counts is relatively straightforward. Leveraging the HBase Java client APIs using JNBridgePro to create .NET proxies is key to the simplicity. By keeping the MapReduce job both on the Java side and generic, any table can be filtered and reduced to frequencies of one particular column.
The source for this example can be downloaded here.